As the internet becomes increasingly saturated with websites competing for attention, performance optimisation is one of the few ways you can still maintain a competitive edge.
This is where Core Web Vitals comes in.
Core Web Vitals focus on three primary aspects of web performance: loading, interactivity, and visual stability. Largest Contentful Paint (LCP), First Input Delay (FID), and Cumulative Layout Shift (CLS) provide a comprehensive view of a website’s user experience.
But why have Core Web Vitals become so important to Google?
The answer lies in Google’s commitment to enhancing the overall web ecosystem. As a search engine giant, Google aims to deliver the best possible results to its users. By prioritising websites that offer a superior user experience, Google ensures that users are more likely to find what they are looking for quickly and efficiently. This not only improves user satisfaction but also keeps users coming back to Google for their search needs.
Google has also integrated Core Web Vitals into its ranking algorithm, making these metrics a significant factor in search engine optimization (SEO). Websites that score well on Core Web Vitals are more likely to rank higher in search results, driving more organic traffic.
In this blog, we will delve into the intricacies of Core Web Vitals, exploring how to collect and analyse data to improve website performance.
A Deep Dive Into Core Web Vitals
Google’s Core Web Vitals is made up of three key metrics that you need to focus on.
Largest Contentful Paint (LCP)
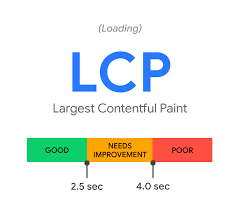
LCP measures the time it takes for the largest content element (such as an image or a block of text) on a web page to become visible on a screen. This metric reflects the loading performance of a webpage.
Ideal Threshold: An LCP of 2.5 seconds or less is considered good. An LCP between 2.5 and 4 seconds needs improvement, while an LCP over 4 seconds is poor.
Typical Causes of Poor LCP:
- Slow server response times: Delays in fetching resources from the server can significantly impact LCP.
- Render-blocking JavaScript and CSS: JavaScript and CSS that block the rendering of page content can delay the display of the largest content element.
- Resource load times: Large or unoptimised images, videos, and other media elements can take longer to load, affecting LCP.
- Client-side rendering: Complex client-side rendering processes can delay the display of the largest content element.
First Input Delay (FID)
FID measures the time from when a user first interacts with a page (e.g., clicking a link, tapping a button) to the time when the browser can begin processing that interaction. This metric reflects the interactivity and responsiveness of a webpage.
Ideal Threshold: An FID of 100 milliseconds or less is considered good. An FID between 100 and 300 milliseconds needs improvement, while an FID over 300 milliseconds is poor.
Typical Causes of Poor FID:
- Heavy JavaScript execution: Long JavaScript tasks can block the main thread, delaying the processing of user interactions.
- Third-party scripts: Scripts from third-party services (e.g., ads, analytics) can add to the execution time and block user interactions.
- Large bundles of JavaScript: Large or unoptimised JavaScript bundles can take longer to parse, compile, and execute.
Cumulative Layout Shift (CLS)
CLS measures the sum of all unexpected layout shifts that occur during the lifespan of a webpage. This metric reflects the visual stability of a webpage, ensuring that content doesn’t shift unexpectedly as users interact with it.
Ideal Threshold: A CLS score of 0.1 or less is considered good. A CLS score between 0.1 and 0.25 needs improvement, while a CLS score over 0.25 is poor.
Typical Causes of Poor CLS:
- Unspecified dimensions for media: Images, videos, and other media without specified dimensions can cause layout shifts when they load.
- Dynamically injected content: Adding content to the page without reserving space for it in advance can cause layout shifts.
- Web fonts causing FOIT/FOUT: Flash of Invisible Text (FOIT) or Flash of Unstyled Text (FOUT) due to web fonts loading can cause layout shifts.
- Ads, embeds, and iframes: These elements can load asynchronously and cause unexpected shifts if not properly managed.
Collecting and Analysing the Data That Matters
Tracking Core Web Vitals is essential for maintaining and improving your website’s performance. Several tools can help you measure these metrics and provide actionable insights. Here’s an overview of the most popular tools and guidance on how to interpret the data they provide.
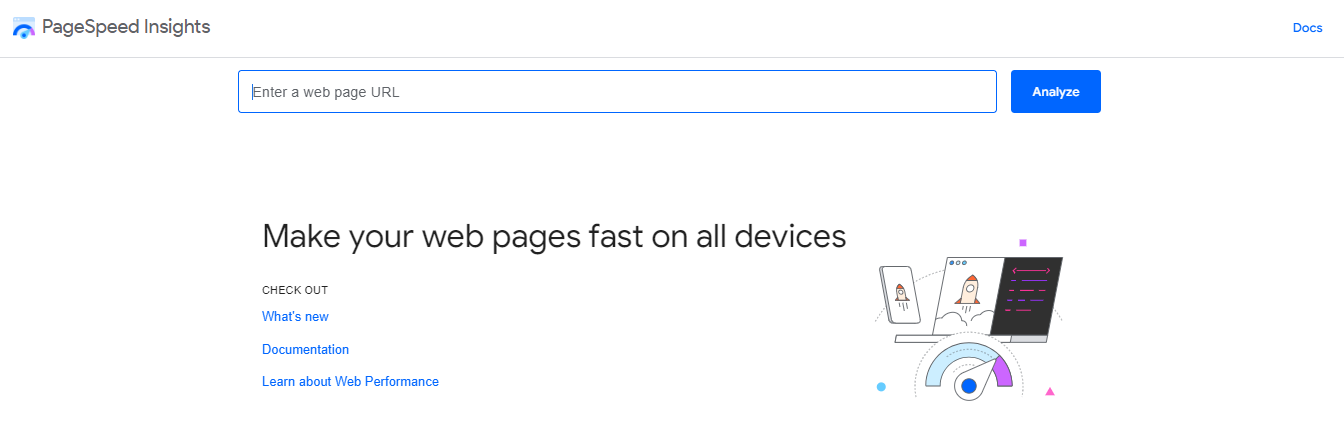
Google PageSpeed Insights
Google PageSpeed Insights analyses the content of a web page and provides suggestions to make it faster. It reports on both lab data (simulated data) and field data (real-world data) to give a comprehensive view of your site’s performance.
Interpreting the Data:
- Performance Score: A score between 0-100 that indicates the overall performance of the page. Higher scores indicate better performance.
- Field Data: This is real-world data collected from users visiting your site. Look for metrics labelled “Good,” “Needs Improvement,” or “Poor.”
- Lab Data: You can identify potential issues during development using this simulated data.
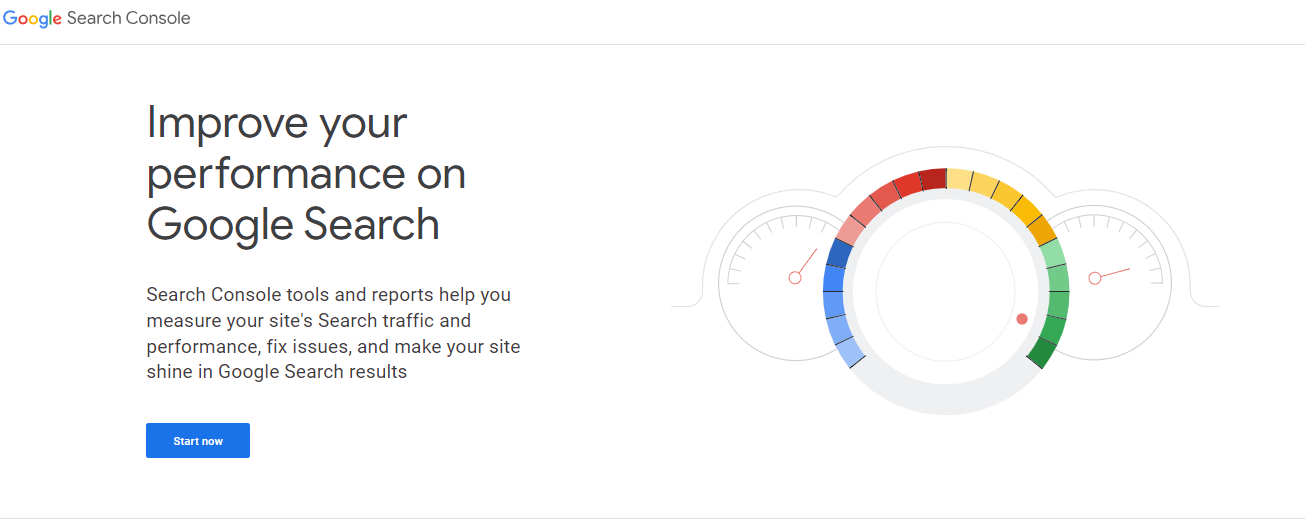
Google Search Console
Google Search Console provides insights into how your website performs in Google Search. It includes a Core Web Vitals report that highlights issues affecting your site’s user experience.
Interpreting the Data:
- Core Web Vitals Report: This report shows URLs categorised as “Good,” “Needs Improvement,” or “Poor” based on their performance.
- Performance Trends: These trends allow you to track changes over time to see if your optimisations are effective.
- Specific Issues: Click on individual URLs to see detailed reports and recommendations for improvement.
Lighthouse
Lighthouse is an open-source, automated tool designed to improve the quality of web pages. It can run in Chrome DevTools, from the command line, or as a Node module.

Interpreting the Data:
- Performance Score: Similar to PageSpeed Insights, you will see a score between 0-100.
- Detailed Audits: Each audit provides specific details and recommendations on how to fix issues.
- Opportunities and Diagnostics: These reports highlight areas where performance can be improved and provide metrics to help diagnose issues.
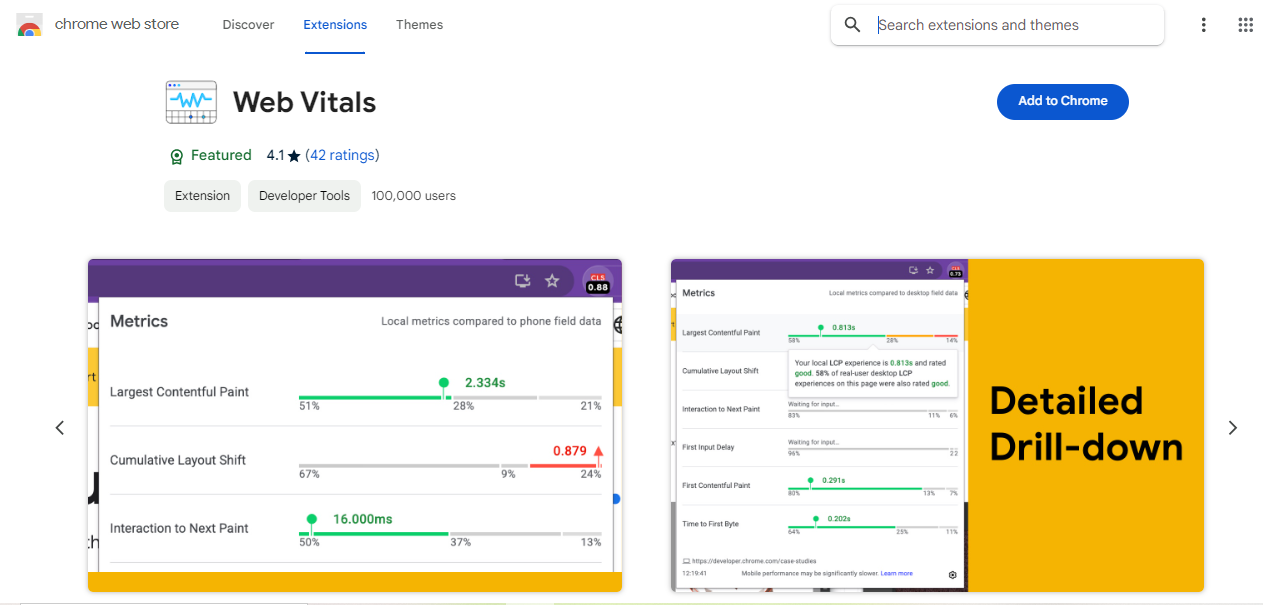
Web Vitals Chrome Extension
The Web Vitals Chrome Extension measures Core Web Vitals metrics in real-time as you browse the web. It’s useful for quickly assessing performance without leaving your browser.
Interpreting the Data:
- Real-Time Metrics: Watch how metrics change as you interact with the page.
- Threshold Indicators: The extension highlights whether each metric is “Good,” “Needs Improvement,” or “Poor.”
- Quick Diagnoses: Use it to identify issues on the fly and test the impact of changes immediately.
Simple Strategies for Improving Core Web Vitals
If you would like to start taking steps to improve your Core Web Vitals stats, here are some simple steps you can take:
- Optimise Images. Use tools like TinyPNG or ImageOptim to reduce image file sizes without compromising quality. You should also implement modern image formats like WebP for better compression and faster loading.
- Improve Server Response Times. To improve server response times, consider distributing content across multiple servers to reduce latency. You also want to ensure your server is configured to handle requests efficiently and that you’ve implemented caching strategies.
- Minimise Render-Blocking Resources. Use the async or defer attributes to load JavaScript files without blocking the rendering of the page. You can also inline critical CSS directly into the HTML to reduce the time it takes for a browser to render the page.
- Optimise JavaScript Execution. Remove unused JavaScript and break down large scripts into smaller, more manageable chunks.
- Reduce Third-Party Scripts. Regularly review and remove any unnecessary third-party scripts that add to the page load time. You should also only load third-party scripts when they are needed, such as when a user interacts with a particular feature.
- Set Size Attributes for Media. Always define width and height attributes for images, videos, and iframes to reserve space in a layout.
- Avoid Inserting Content Above Existing Content. Use the font-display CSS property to control how fonts are displayed during loading, avoiding layout shifts caused by font loading. It’s also important to ensure that space is reserved for any dynamically injected content, such as ads or pop-ups.
- Use a Performance Budget. Define a performance budget for your website, setting limits on the size and number of resources loaded. You should also continuously monitor performance and make adjustments to stay within the defined budget.
- Optimise Web Fonts. Only include the characters needed for your site to reduce font file sizes. Use the link rel=”preload” attribute to load fonts quickly and efficiently.
Final Thoughts
Improving your website’s performance is essential for providing an exceptional user experience and achieving higher search engine rankings. By focusing on Core Web Vitals, you can identify and address key areas that impact your site’s usability and efficiency.
Ready to take your WordPress site to the next level? WP Support Specialists is here to help. With expert knowledge and experience, we can assist you in optimising your website’s performance, ensuring that it meets and exceeds Core Web Vitals standards. Contact us today to learn how we can enhance your website’s speed, interactivity, and visual stability for a better user experience and improved SEO performance.